Strategy developer guide
How to build your own strategy in the AvalonQuant kit: the no-code builder, the Python strategy format and ctx API reference, indicator functions, stop options, reading a backtest, three examples with real results, common mistakes, the sandbox and API key safety.
Kit coming soon: the kit download is not open yet. This guide describes the kit's strategy builder ahead of release. It is educational material, not investment advice, and no performance is guaranteed.
Getting started
The AvalonQuant kit is an automated trading tool that runs on your own computer. You build a strategy, backtest it on past prices and run it in virtual trading or live trading. Those are the only two ways it runs: live trading and the kit's own virtual trading.
1. Install the kit (coming soon)
The kit is coming soon. When the download opens, get it from /downloads and run the installer (install.command on macOS, install.bat on Windows). The dashboard on your computer then opens in the browser.
2. Connect a read-only API key for market data
Virtual trading needs real prices too. To start virtual trading, enter your exchange or broker's live API key as a read-only (market data) key under Accounts. In virtual trading no order is sent; the kit fills orders against real prices itself. A withdrawal permission is never needed.
3. Your first strategy
- Open 'Strategy builder' in the side menu.
- Use 'Fill with an example' and pick 'Moving-average cross' (a learning example, no performance claim).
- Press 'Check' to catch empty conditions or out-of-range values, then 'Save'.
- Press 'Backtest' to see past results and the in-sample / out-of-sample split.
- On the strategies screen, tick 'Run' to start it in virtual trading. Turn on live trading separately, only after checking it in virtual trading.
Plans
Free: building and backtesting are unlimited; one strategy can run, in virtual trading. Paid: as many strategies run at once as the plan has slots (virtual or live). No-code and code strategies share the same slots.
Using the no-code builder
The no-code tab assembles blocks without code. Signals are taken at the bar close and orders fill at the next bar's open. The backtest, virtual trading and live trading all use the same rule engine.
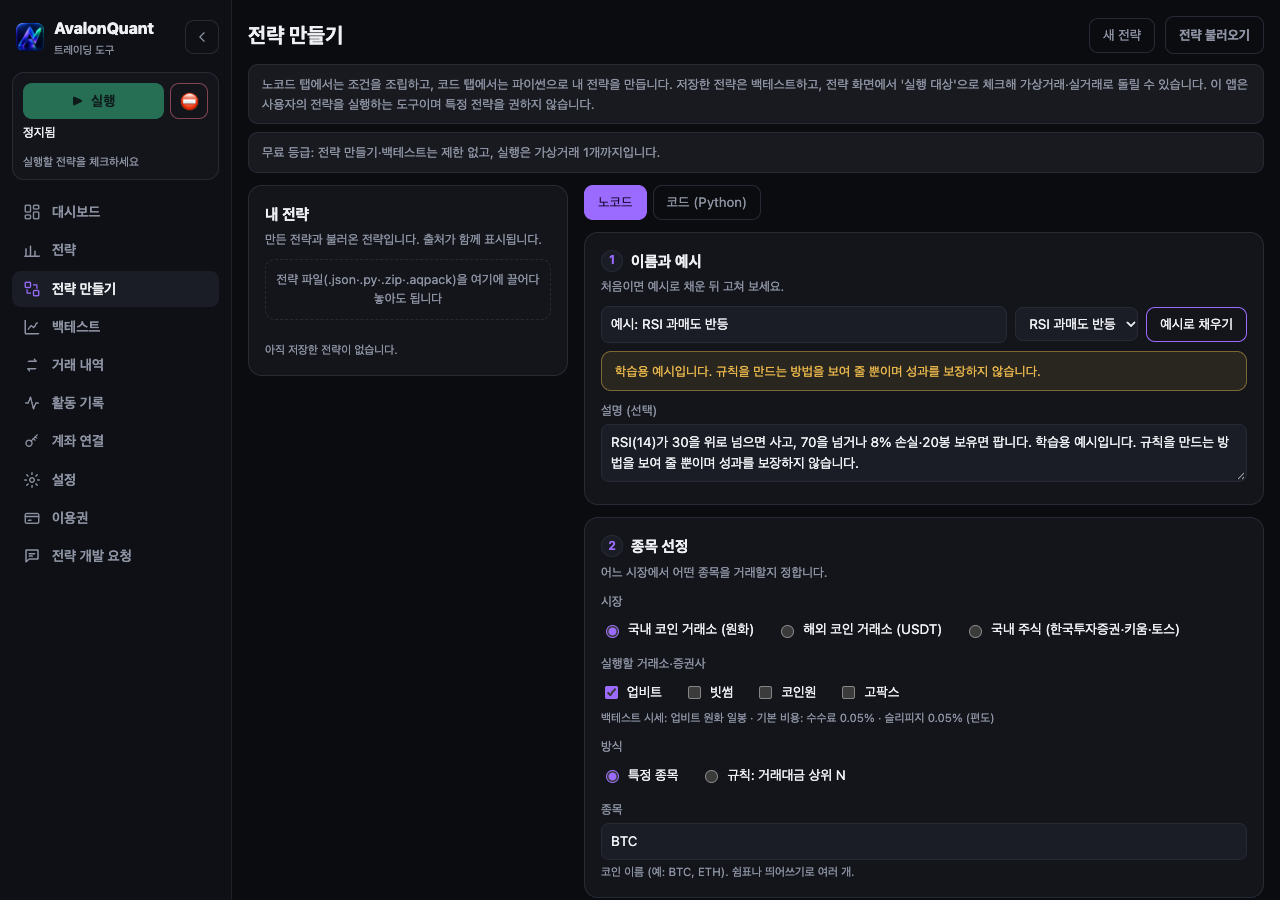
Condition blocks
A block is [indicator (parameters)] [comparison] [value or another indicator]. Comparisons: greater, less, at least, at most, crosses above, crosses below. Groups with AND/OR nest one level.
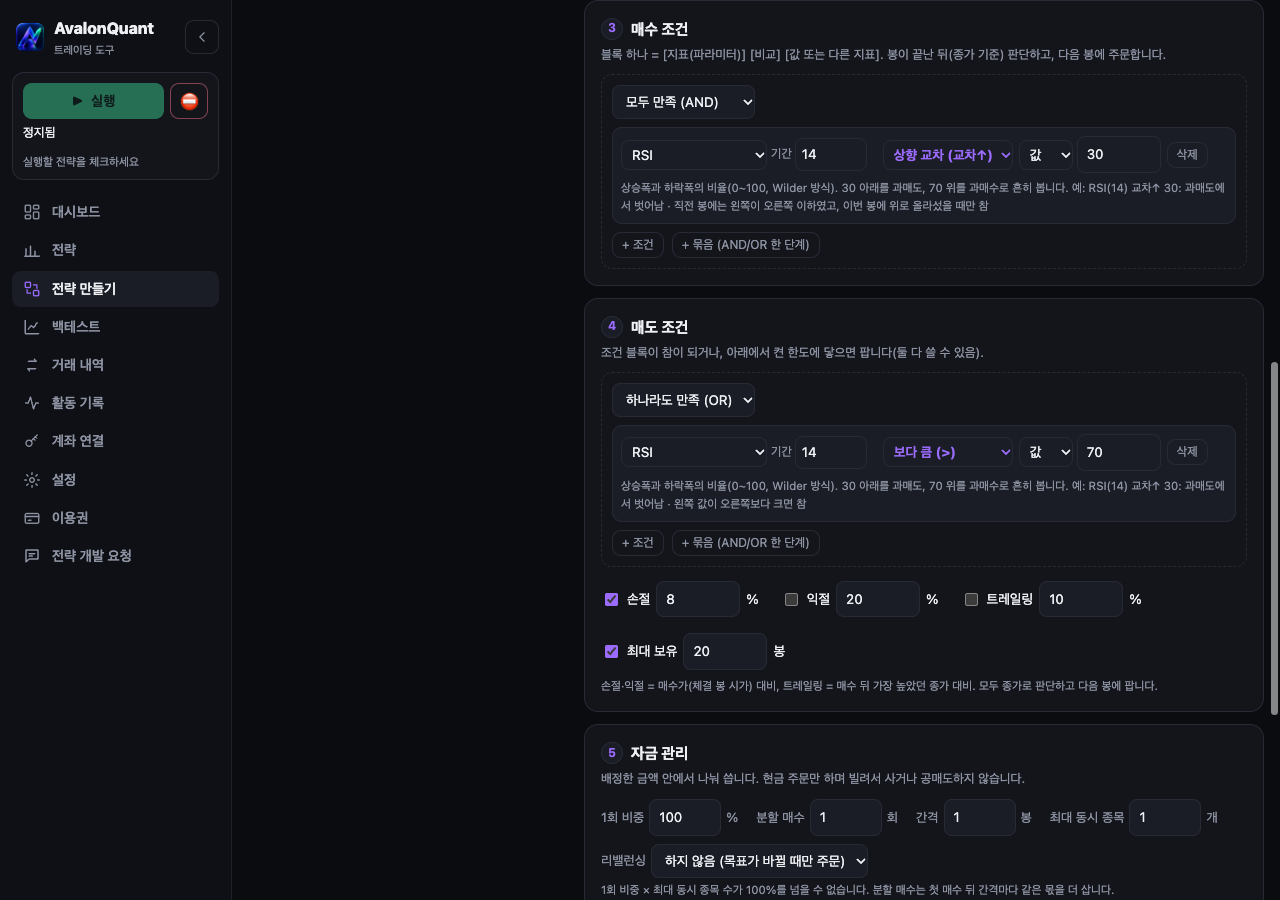
Exits and risk
Next to the sell conditions you can tick stop-loss, take-profit, trailing stop and a holding limit. All are judged on the close and sell on the next bar. Money management sets the weight per entry, split entries, maximum positions and rebalancing. Weight x maximum positions can't exceed 100% (cash orders only).
Checks before saving
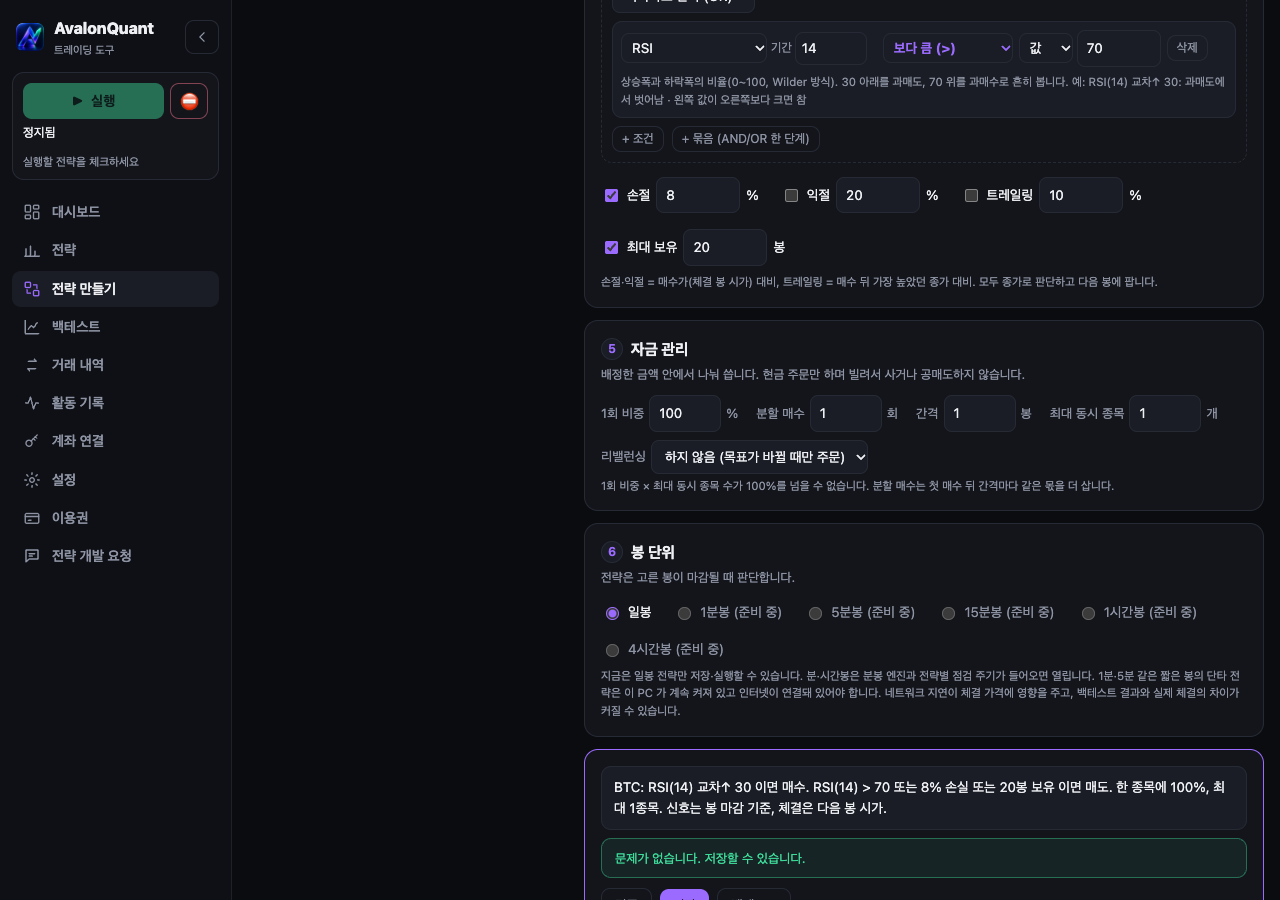
'Check' lists every problem at once: empty conditions, comparing an indicator with itself, a sell condition identical to the buy condition, out-of-range values, weights over 100% and the indicator window limit. A valid strategy is summarized in one sentence.
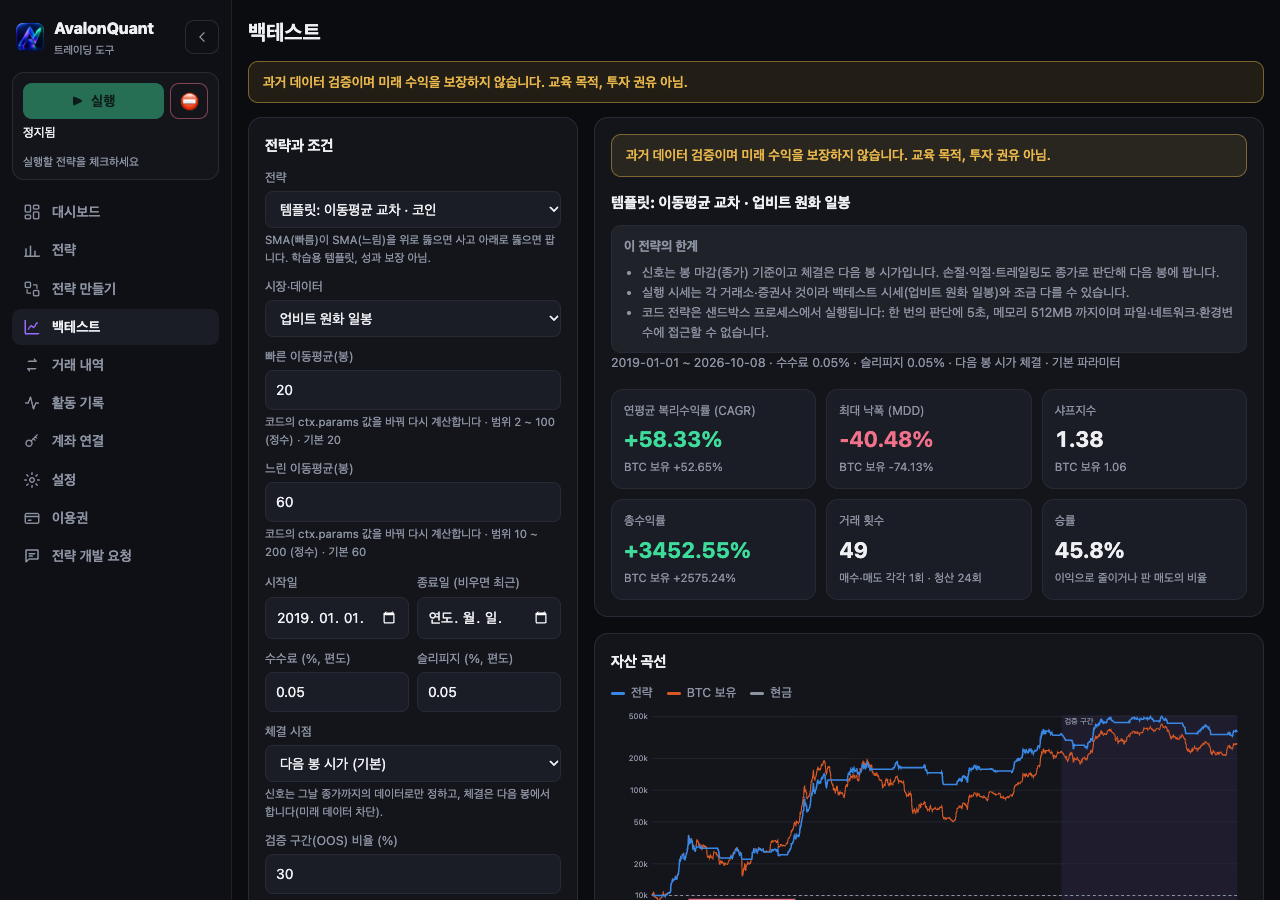
The backtest screen
A saved strategy can be re-run on the backtest screen with a different period, fees, slippage, fill time, out-of-sample share and parameters.
Code strategies (Python)
The code tab takes a strategy as one Python file. It runs on the same backtest engine and the same virtual/live execution path as no-code rules, so the same rule gives the same result (see the comparison under Examples).
Format
The file needs two things. META is a values-only dict with the name, market, symbols, parameters and stop options; decide(ctx) is called once per completed bar and returns target weights.
META = {
    "name": "My first code strategy",
    "market": "crypto_krw",
    "venues": ["upbit"],
    "symbols": ["BTC"],
    "params": {"n": {"type": "int", "default": 50, "min": 10, "max": 200}},
    "risk": {"stop_loss_pct": 10},
}


def decide(ctx):
    ma = ctx.sma("BTC", ctx.params["n"])
    if ma is None:
        return None            # not enough bars yet: keep what we have
    if ctx.close("BTC")[-1] > ma:
        return {"BTC": 1.0}    # 100% of the strategy's money
return {} # sell everything (cash)- {symbol: weight}: weights 0..1 adding up to at most 1. Missing symbols are 0 (sold). Write "BTC" or the engine key "KRW-BTC".
- {}: sell everything, hold cash.
- None: keep what is held (no orders). The usual shape returns a dict only on the bar a signal fires (a crossing) and None otherwise.
- No shorting or borrowing. A negative weight or weights above 1 are an error that stops the strategy.
Editor and checks before saving
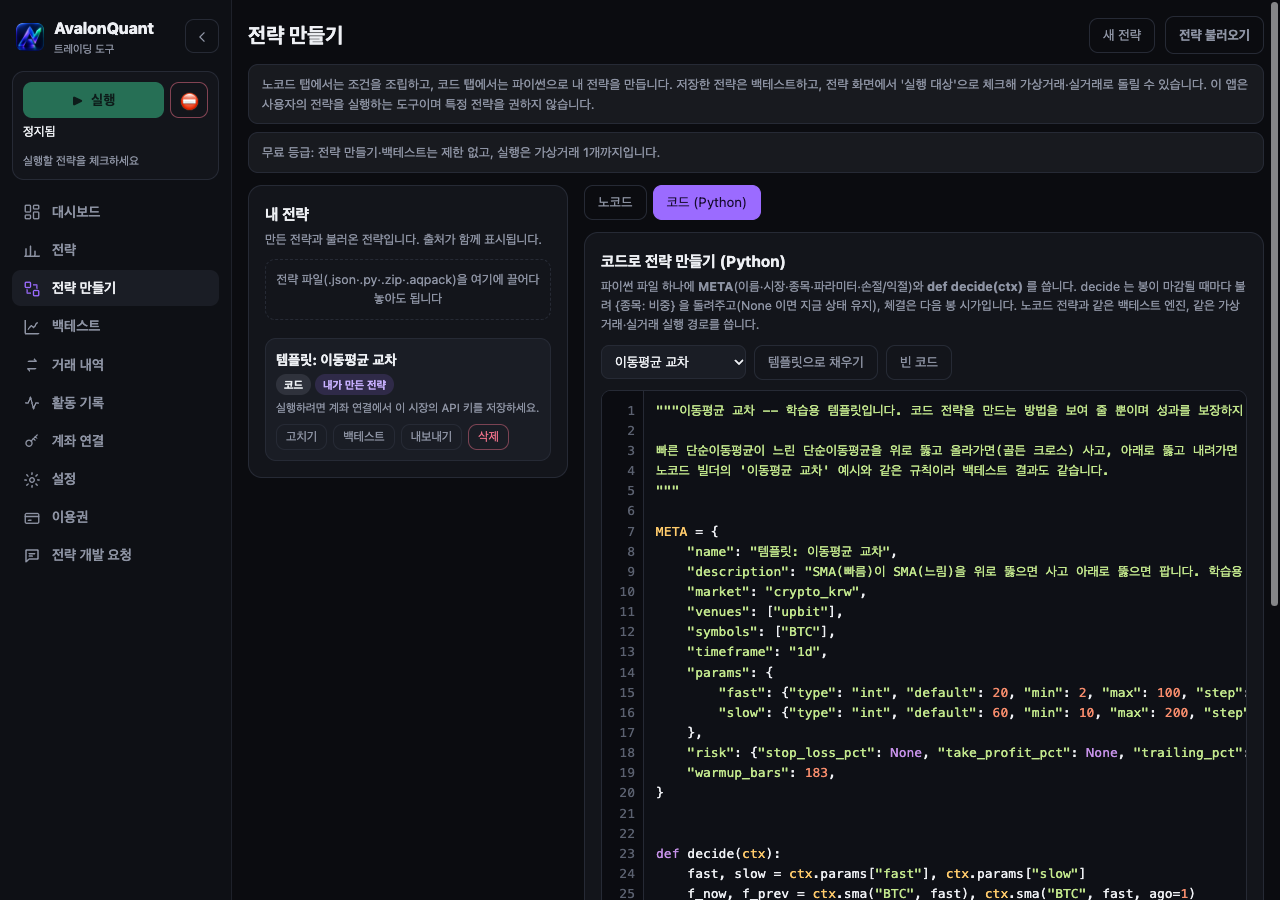
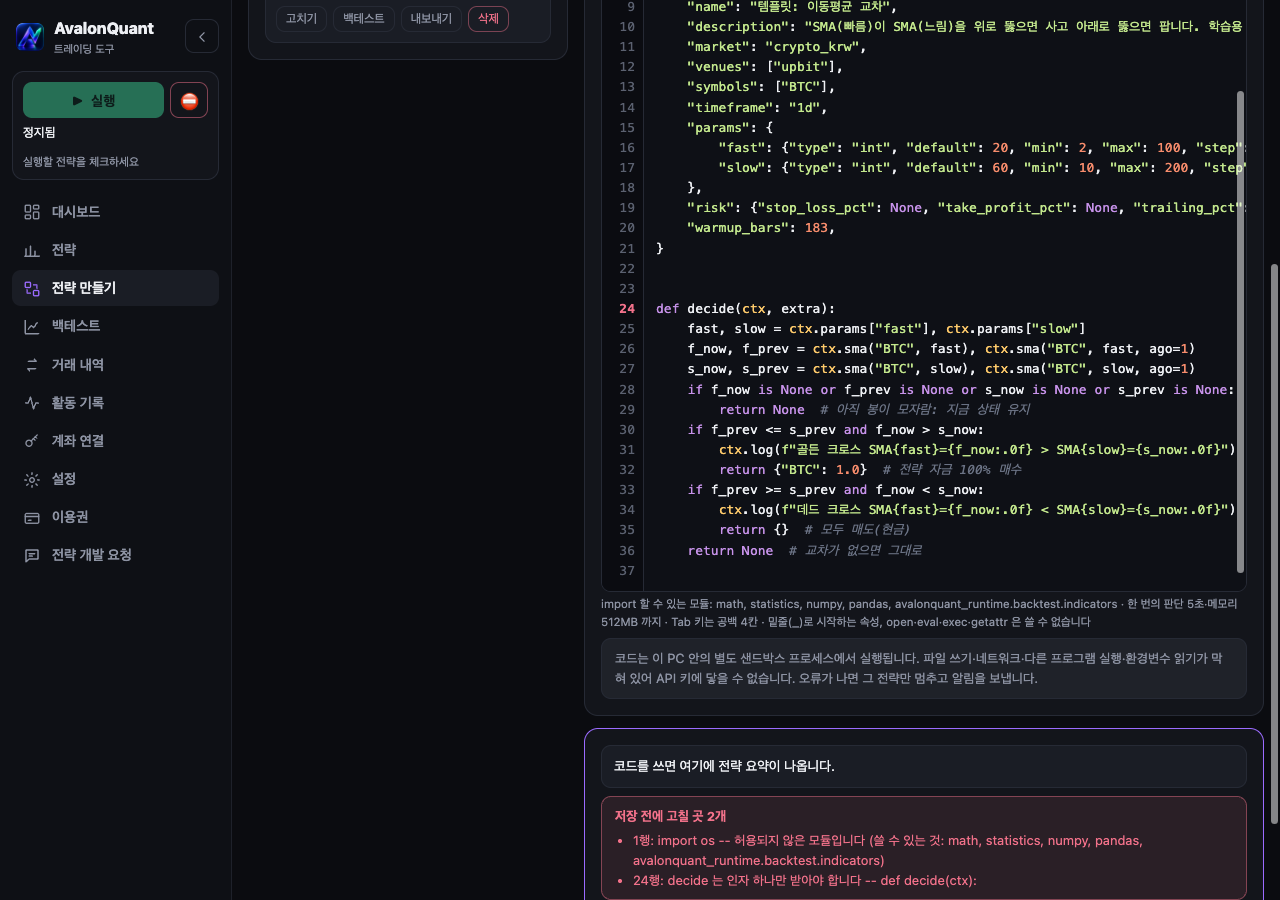
The editor highlights syntax and numbers lines; while you type it checks syntax, imports outside the allow-list, the decide(ctx) signature and META, with line numbers. The three templates (moving-average cross, relative momentum rotation, RSI mean reversion) are for learning and promise no performance.
ctx API reference
These tables are generated from the docstrings in the kit's code (rules/code_api.py).
| Field | Type | Description |
|---|---|---|
ctx.symbols | tuple[str] | The symbols this strategy trades, as engine keys (KRW-BTC, BTCUSDT, 005930), in META order. |
ctx.now | str | The decision's bar date (the last completed bar), "YYYY-MM-DD". The order fills at the next bar's open. |
ctx.params | dict | This run's parameter values: META["params"] defaults, or what the backtest screen set. |
ctx.positions | dict[str, float] | What the strategy holds now as target weights {symbol: 0..1}: what its last decisions and the stops left. Prices move after a fill, so the account's actual share drifts a little. |
ctx.cash | float | 1 - sum(positions): the share of the strategy's money not in a position. |
ctx.state | dict | A dict kept from one decision to the next: JSON values only, 64 KB at most. Starts empty. |
| Function | Description |
|---|---|
ctx.bars(symbol: 'str') -> Bars | The symbol's completed bars up to the decision's bar (at most 300, a Bars). KeyError for a symbol with no bars yet. |
ctx.close(symbol: 'str') -> tuple | Closing prices, oldest first (same as ctx.bars(symbol).close). |
ctx.has(symbol: 'str') -> bool | True if the symbol has a bar on the decision's date (listed and traded that day). |
ctx.weight(symbol: 'str') -> float | The weight held in this symbol now (0..1, 0 when not held) -- ctx.positions looked up by symbol name. |
ctx.entry_price(symbol: 'str') -> float | None | The held position's fill price (the open of the bar it was bought on), or None when not held. |
ctx.bars_held(symbol: 'str') -> int | None | Completed bars since the bar the buy was decided on, or None when not held. |
ctx.log(*parts) -> None | A note about this decision, recorded with its reason (20 lines a decision, 300 characters a line). |
Bars: One symbol's completed bars, oldest first, the last one being the decision's bar (read-only). `date`, `open`, `high`, `low`, `close`, `volume` are tuples of the same length; `len(bars)` is the count (at most 300); `bars[-1]` and `bars.last` are the last bar as a dict.
Indicator functions
Every indicator function returns its last value (a float), or None while there are too few bars. ago=1 is the previous bar's value (for crossings). Indicators are computed on a window of 3x the bars they need (at least 60, at most 250), so they match the no-code builder exactly.
| Function | Indicator | Argument ranges | Returns |
|---|---|---|---|
ctx.sma(symbol: 'str', n: 'int' = 20, ago: 'int' = 0) -> float | None | Simple moving average (SMA) | n 2~200 | Simple moving average of the last n closes. |
ctx.ema(symbol: 'str', n: 'int' = 20, ago: 'int' = 0) -> float | None | Exponential moving average (EMA) | n 2~200 | Exponential moving average, alpha = 2/(n+1), seeded with the first n closes' mean. |
ctx.rsi(symbol: 'str', n: 'int' = 14, ago: 'int' = 0) -> float | None | RSI | n 2~100 | Wilder RSI, 0..100. |
ctx.macd(symbol: 'str', fast: 'int' = 12, slow: 'int' = 26, signal: 'int' = 9, field: 'str' = 'line', ago: 'int' = 0) -> float | None | MACD | fast 2~100, slow 3~200, signal 2~100 | MACD. field: "line" (EMA fast - EMA slow), "signal" (EMA of the line), "hist" (line - signal). |
ctx.bb(symbol: 'str', n: 'int' = 20, k: 'float' = 2.0, field: 'str' = 'middle', ago: 'int' = 0) -> float | None | Bollinger bands | n 2~200, k 0.5~5.0 | Bollinger bands. field: "upper", "middle" (SMA n), "lower" (middle -/+ k x population sd), "pctb" ((close - lower) / (upper - lower)). |
ctx.adx(symbol: 'str', n: 'int' = 14, field: 'str' = 'adx', ago: 'int' = 0) -> float | None | ADX (trend strength) | n 2~100 | Wilder ADX (trend strength 0..100). field: "adx", "plus_di", "minus_di". |
ctx.atr(symbol: 'str', n: 'int' = 14, ago: 'int' = 0) -> float | None | ATR (average true range) | n 2~100 | Wilder average true range, in price units. |
ctx.stoch(symbol: 'str', k: 'int' = 14, d: 'int' = 3, field: 'str' = 'k', ago: 'int' = 0) -> float | None | Stochastic | k 2~100, d 1~50 | Stochastic oscillator. field: "k" (%K over k bars), "d" (SMA d of %K), 0..100. |
ctx.volume_sma(symbol: 'str', n: 'int' = 20, ago: 'int' = 0) -> float | None | Volume moving average | n 2~200 | Average volume of the last n bars. |
ctx.high_n(symbol: 'str', n: 'int' = 20, ago: 'int' = 0) -> float | None | N-bar high | n 2~200 | Highest high of the n bars before this one (this bar excluded); close > high_n is an n-bar breakout. |
ctx.low_n(symbol: 'str', n: 'int' = 20, ago: 'int' = 0) -> float | None | N-bar low | n 2~200 | Lowest low of the n bars before this one (this bar excluded). |
ctx.rvol(symbol: 'str', n: 'int' = 20, ago: 'int' = 0) -> float | None | Realized volatility (annualized %) | n 2~200 | Realized volatility in %: sample sd of the last n log returns, annualized (365 coins, 252 stocks). |
META keys
| Key | Type | Required | Description |
|---|---|---|---|
name | str | yes | Strategy name (up to 60 characters). |
description | str | no | Description (up to 600 characters). |
market | str | yes | crypto_krw (Korean exchanges, KRW) · crypto_usdt (global exchanges, USDT) · kr_stock (Korean stocks). |
venues | list[str] | no | Exchanges/brokers to run on. Default: the market's first (upbit · binance · kis). |
symbols | list[str] | yes | 1 to 30 symbols. Coins as BTC, ETH; Korean stocks as 6-digit codes (005930). |
timeframe | str | no | Bar size. Only "1d" (daily) for now. |
params | dict | no | Parameter schema (up to 8). The backtest screen edits them and draws the sensitivity table. |
risk | dict | no | Stop-loss, take-profit, trailing and holding limit, handled by the engine (table below). |
costs | dict | no | {"fee_pct", "slippage_pct"}, one-way %. Default: the market's. |
warmup_bars | int | no | Bars a backtest waits before the first decision (1-250, default 200). |
Parameter schema
Each entry of META["params"] takes the keys below. The backtest screen builds its inputs from this schema, and the sensitivity table re-runs around the default (+/- 2 steps).
| Key | Type | Required | Description |
|---|---|---|---|
type | str | no | "int" or "float" (default float). |
default | number | yes | Default value (within min..max). |
min | number | yes | Minimum. |
max | number | yes | Maximum. |
step | number | no | Step the sensitivity table varies it by. |
label | str | no | Name shown on screen (up to 40 characters). |
Stop options
META["risk"] is declared and the engine does the rest, through the same code as the no-code builder's stops. All are judged on the close and sell at the next bar's open. A symbol a stop sold is not bought back on that same bar.
| Key | Range | Description |
|---|---|---|
stop_loss_pct | 0.1 ~ 90.0 % | Sell on the next bar once a close is this % below the entry (the fill bar's open). |
take_profit_pct | 0.1 ~ 1000.0 % | Sell on the next bar once a close is this % above the entry. |
trailing_pct | 0.1 ~ 90.0 % | Sell on the next bar once a close is this % below the highest close since entry. |
max_hold_bars | 1 ~ 200 bars | Sell on the next bar once this many bars have passed since the buy decision. |
Markets
| <code>market</code> | Market | venues | Backtest data | Default fee / slippage |
|---|---|---|---|---|
crypto_krw | Korean coin exchanges (KRW) | upbit, bithumb, coinone, gopax | Upbit KRW daily bars | 0.05% / 0.05% |
crypto_usdt | Global coin exchanges (USDT) | binance, bybit, bitget, okx, gate | Binance USDT daily bars | 0.1% / 0.05% |
kr_stock | Korean stocks | kis, kiwoom, toss | Broker API daily bars (with your own broker key) | 0.015% / 0.1% |
Imports and run limits
| import | What |
|---|---|
math | Standard math functions |
statistics | Standard statistics functions |
numpy | Arrays |
pandas | Tables |
avalonquant_runtime.backtest.indicators | AvalonQuant indicator module (the same calculations as the builder and the backtest) |
Limits: 5 s per decision (30 s to start), 512 MB of memory, ctx.state up to 64 KB, code up to 100 KB, up to 30 symbols and 8 parameters, 300 bars per decision.
Not allowed: __builtins__, __import__, breakpoint, compile, delattr, eval, exec, exit, getattr, globals, help, input, locals, memoryview, open, quit, setattr, vars, and any attribute starting with an underscore (_).
Delivered strategies, import and export
Code strategies export and import as .py files. Strategies AvalonQuant delivers through custom development use the same format; the signature on the file's last line (# aq-signature:) shows them as 'Made by AvalonQuant (commissioned)'. An unsigned or altered file shows as a 'user file' and does not run until you confirm the warning. Edit a delivered strategy and it becomes your own; exporting it then drops the signature.
Reading a backtest
CAGR (compound annual growth rate)
The yearly compound growth that turns the starting equity into the ending equity. Over short periods one or two big moves swing it a lot.
Maximum drawdown (MDD)
The largest fall from a previous equity peak. Ask first whether you could sit through that fall and keep the strategy running. The result screen's weak periods show the deepest drawdown's peak, trough and recovery dates.
Sharpe ratio
The mean of daily returns divided by their standard deviation, annualized (365 days for coins, 252 for stocks, risk-free rate 0). It shows how much volatility the return came with.
Sensitivity
The table re-runs the backtest with each parameter moved around its default. If results are good at one value and collapse next to it, the strategy is probably overfit. The result screen marks a parameter as holding when neighbouring values keep at least half the default's Sharpe.
In-sample / out-of-sample split
By default the last 30% of the period is held out (OOS) and computed separately. Choose parameters on the in-sample period only; the result screen warns when the OOS result is less than half of the in-sample one. Below: the moving-average cross template on real Upbit daily bars. The same strategy does very differently in different periods.
| In-sample (2018-12-31 ~ 2024-06-03) | Out-of-sample (2024-06-03 ~ 2026-09-30) | Holding BTC (whole period) (2018-12-31 ~ 2026-09-30) | |
|---|---|---|---|
| CAGR | +91.21% | +2.91% | +53.08% |
| Max drawdown | -40.48% | -35.19% | -74.13% |
| Sharpe | 1.72 | 0.24 | 1.06 |
Daily-bar fill assumptions and limits
- Signals are taken at the bar close; orders fill at the next bar's open. There is no same-bar-close fill (no look-ahead).
- Stops are judged on the close too. If price passes the stop intraday it still sells at the next open, so a gap can lose more than the stop distance.
- Fees and slippage are charged on every one-way trade (Korean coin exchanges: 0.05% + 0.05% by default). Real fill prices, tick sizes and minimum order sizes can differ from the backtest.
- Only daily bars can be saved and run for now. Minute and hour bars open once the intraday engine is in.
Three examples: full code and results
These are the templates exactly as the kit ships them. The numbers come from actually running the kit's backtest (same engine, same sandbox) on Upbit KRW daily bars, and the kit's tests re-run this guide's code and numbers. All are for learning; no performance is guaranteed.
Moving-average cross
"""Moving-average cross -- a learning template. It shows how a code strategy is put together; no performance is promised.

Buy when the fast simple moving average crosses above the slow one (golden cross), sell when it crosses below.
The same rule as the no-code builder's 'moving-average cross' example, so the backtest result is the same too.
"""

META = {
    "name": "Template: moving-average cross",
    "description": "Buy when SMA(fast) crosses above SMA(slow), sell when it crosses below. Learning template, no performance claim.",
    "market": "crypto_krw",
    "venues": ["upbit"],
    "symbols": ["BTC"],
    "timeframe": "1d",
    "params": {
        "fast": {"type": "int", "default": 20, "min": 2, "max": 100, "step": 2, "label": "Fast moving average (bars)"},
        "slow": {"type": "int", "default": 60, "min": 10, "max": 200, "step": 6, "label": "Slow moving average (bars)"},
    },
    "risk": {"stop_loss_pct": None, "take_profit_pct": None, "trailing_pct": None, "max_hold_bars": None},
    "warmup_bars": 183,
}


def decide(ctx):
    fast, slow = ctx.params["fast"], ctx.params["slow"]
    f_now, f_prev = ctx.sma("BTC", fast), ctx.sma("BTC", fast, ago=1)
    s_now, s_prev = ctx.sma("BTC", slow), ctx.sma("BTC", slow, ago=1)
    if f_now is None or f_prev is None or s_now is None or s_prev is None:
        return None  # not enough bars yet: keep what we have
    if f_prev <= s_prev and f_now > s_now:
        ctx.log(f"golden cross SMA{fast}={f_now:.0f} > SMA{slow}={s_now:.0f}")
        return {"BTC": 1.0}  # 100% of the strategy's money
    if f_prev >= s_prev and f_now < s_now:
        ctx.log(f"dead cross SMA{fast}={f_now:.0f} < SMA{slow}={s_now:.0f}")
        return {}  # sell everything (cash)
    return None  # no crossing: as it is
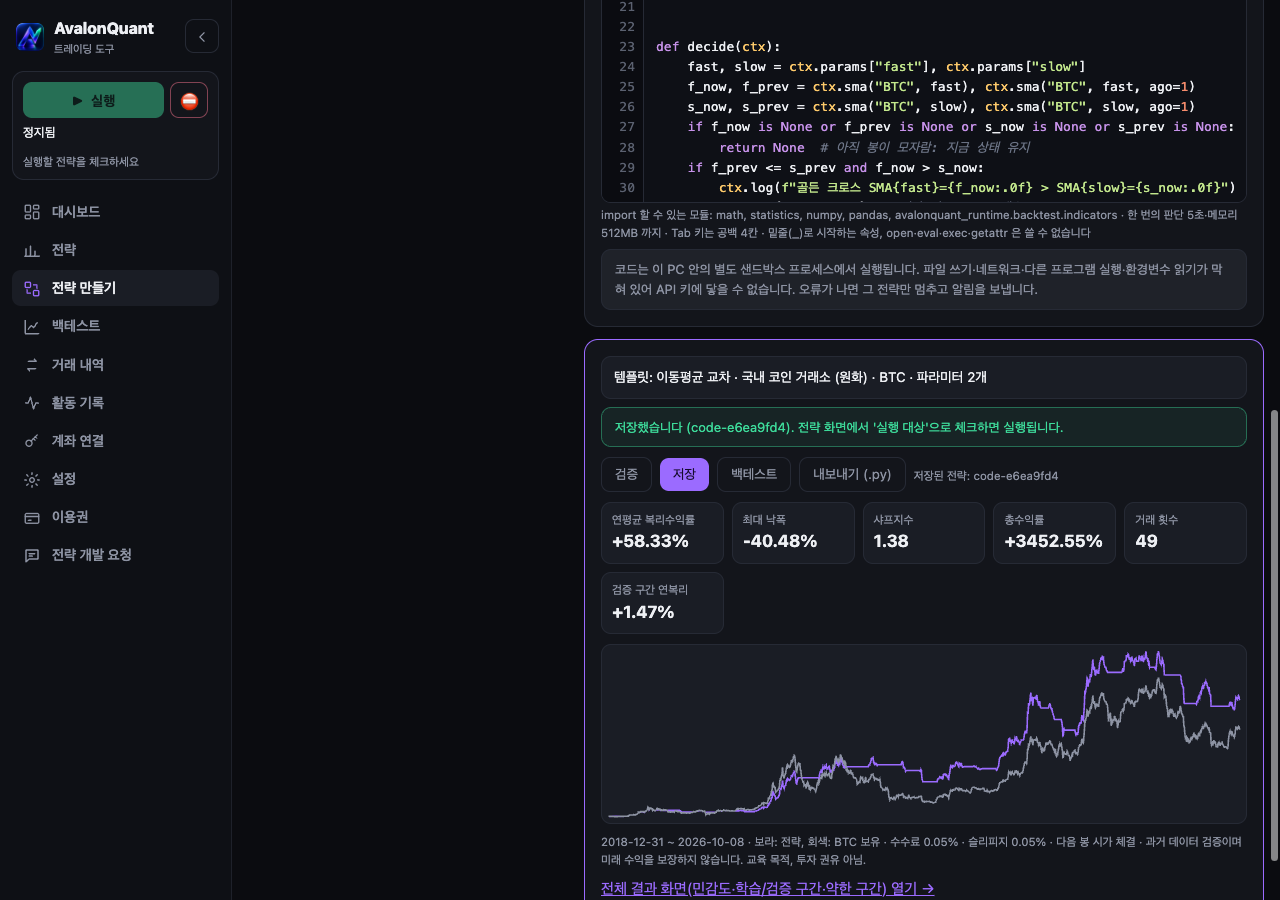
Upbit KRW daily bars, 2018-12-31 ~ 2026-09-30, fee 0.05% + slippage 0.05% per trade, filled at the next bar's open, default parameters.
| Metric | Result |
|---|---|
| CAGR | +58.78% |
| Max drawdown | -40.48% |
| Sharpe | 1.39 |
| Total return | +3496.18% |
| Trades | 49 |
| Win rate | 45.8% |
Sensitivity: fast
| Value | CAGR | MDD | Sharpe |
|---|---|---|---|
| 16 | +59.03% | -43.13% | 1.39 |
| 18 | +60.52% | -45.59% | 1.41 |
| 20 (default) | +58.78% | -40.48% | 1.39 |
| 22 | +48.58% | -60.67% | 1.18 |
| 24 | +48.47% | -58.42% | 1.17 |
Sensitivity: slow
| Value | CAGR | MDD | Sharpe |
|---|---|---|---|
| 48 | +56.47% | -46.56% | 1.33 |
| 54 | +60.06% | -46.06% | 1.40 |
| 60 (default) | +58.78% | -40.48% | 1.39 |
| 66 | +47.40% | -61.67% | 1.16 |
| 72 | +52.43% | -51.09% | 1.23 |
A learning template: it shows how a code strategy is built and promises no performance.
Relative momentum rotation
"""Relative momentum rotation -- a learning template. It shows how a code strategy is put together; no performance is promised.

On the first bar of each month, compare the candidates' returns over the last N bars and put all of the strategy's
money into the one that rose most. If every one fell (return 0 or below), hold cash. Whether the month has changed
is noted in ctx.state.
"""

META = {
    "name": "Template: relative momentum rotation",
    "description": "On each month's first bar, hold the coin with the highest N-bar return; cash if all are negative. Learning template, no performance claim.",
    "market": "crypto_krw",
    "venues": ["upbit"],
    "symbols": ["BTC", "ETH", "XRP"],
    "timeframe": "1d",
    "params": {
        "lookback": {"type": "int", "default": 90, "min": 10, "max": 250, "step": 10, "label": "Return lookback (bars)"},
    },
    "risk": {"stop_loss_pct": None, "take_profit_pct": None, "trailing_pct": None, "max_hold_bars": None},
    "warmup_bars": 120,
}


def decide(ctx):
    month = ctx.now[:7]
    if ctx.state.get("month") == month:
        return None  # already chose this month: as it is
    ctx.state["month"] = month
    n = ctx.params["lookback"]
    best, best_return = None, 0.0
    for symbol in ctx.symbols:
        if not ctx.has(symbol):
            continue
        close = ctx.close(symbol)
        if len(close) <= n:
            continue
        r = close[-1] / close[-1 - n] - 1
        if r > best_return:
            best, best_return = symbol, r
    if best is None:
        ctx.log(f"every {n}-bar return is 0 or below -- cash")
        return {}
    ctx.log(f"{best} {n}-bar return {best_return * 100:.1f}% -- the highest")
    return {best: 1.0}
Upbit KRW daily bars, 2018-12-31 ~ 2026-09-30, fee 0.05% + slippage 0.05% per trade, filled at the next bar's open, default parameters.
| Metric | Result |
|---|---|
| CAGR | -0.09% |
| Max drawdown | -92.27% |
| Sharpe | 0.34 |
| Total return | -0.69% |
| Trades | 63 |
| Win rate | 48.4% |
Sensitivity: lookback
| Value | CAGR | MDD | Sharpe |
|---|---|---|---|
| 70 | +1.99% | -88.31% | 0.38 |
| 80 | +15.84% | -90.59% | 0.56 |
| 90 (default) | -0.09% | -92.27% | 0.34 |
| 100 | +4.51% | -85.34% | 0.41 |
| 110 | +11.45% | -68.36% | 0.50 |
A learning template: it shows how a code strategy is built and promises no performance.
RSI mean reversion
"""RSI mean reversion -- a learning template. It shows how a code strategy is put together; no performance is promised.

Buy when RSI crosses up through the oversold line (30), sell when it goes above the overbought line (70). The 8%
stop-loss and the 20-bar holding limit are declared in META's risk and handled by the engine. The same rule as the
no-code builder's 'RSI oversold rebound' example, so the backtest result is the same too.
"""

META = {
    "name": "Template: RSI mean reversion",
    "description": "Buy when RSI crosses above the oversold line; sell above the overbought line, at an 8% loss or after 20 bars. Learning template, no performance claim.",
    "market": "crypto_krw",
    "venues": ["upbit"],
    "symbols": ["BTC"],
    "timeframe": "1d",
    "params": {
        "period": {"type": "int", "default": 14, "min": 2, "max": 50, "step": 1, "label": "RSI period (bars)"},
        "low": {"type": "float", "default": 30, "min": 5, "max": 50, "step": 2.5, "label": "Oversold line"},
        "high": {"type": "float", "default": 70, "min": 50, "max": 95, "step": 2.5, "label": "Overbought line"},
    },
    "risk": {"stop_loss_pct": 8, "take_profit_pct": None, "trailing_pct": None, "max_hold_bars": 20},
    "warmup_bars": 60,
}


def decide(ctx):
    p = ctx.params
    now, prev = ctx.rsi("BTC", p["period"]), ctx.rsi("BTC", p["period"], ago=1)
    if now is None or prev is None:
        return None
    if ctx.weight("BTC") > 0:  # holding: sell when overbought
        if now > p["high"]:
            ctx.log(f"RSI {now:.1f} > {p['high']} -- sell")
            return {}
        return None
    if prev <= p["low"] < now:  # not holding: buy when it leaves oversold
        ctx.log(f"RSI {prev:.1f} -> {now:.1f}, crossed above {p['low']} -- buy")
        return {"BTC": 1.0}
    return None
Upbit KRW daily bars, 2018-12-31 ~ 2026-09-30, fee 0.05% + slippage 0.05% per trade, filled at the next bar's open, default parameters.
| Metric | Result |
|---|---|
| CAGR | -7.61% |
| Max drawdown | -60.47% |
| Sharpe | -0.28 |
| Total return | -45.85% |
| Trades | 60 |
| Win rate | 33.3% |
Sensitivity: period
| Value | CAGR | MDD | Sharpe |
|---|---|---|---|
| 12 | -8.93% | -61.46% | -0.32 |
| 13 | -6.78% | -57.75% | -0.21 |
| 14 (default) | -7.61% | -60.47% | -0.28 |
| 15 | -10.47% | -66.47% | -0.45 |
| 16 | -14.93% | -74.42% | -0.74 |
Sensitivity: low
| Value | CAGR | MDD | Sharpe |
|---|---|---|---|
| 25.0 | -12.77% | -67.25% | -0.66 |
| 27.5 | -10.83% | -67.59% | -0.50 |
| 30.0 (default) | -7.61% | -60.47% | -0.28 |
| 32.5 | -5.97% | -57.98% | -0.18 |
| 35.0 | -0.86% | -46.48% | 0.08 |
Sensitivity: high
| Value | CAGR | MDD | Sharpe |
|---|---|---|---|
| 65.0 | -9.60% | -65.88% | -0.40 |
| 67.5 | -8.60% | -62.85% | -0.34 |
| 70.0 (default) | -7.61% | -60.47% | -0.28 |
| 72.5 | -7.61% | -60.47% | -0.28 |
| 75.0 | -7.61% | -60.47% | -0.28 |
A learning template: it shows how a code strategy is built and promises no performance.
No-code and code, the same result
The same strategy built once as a no-code rule and once as code, run on the same prices. The equity curves match bar for bar.
| Strategy | CAGR | MDD | Sharpe | Trades |
|---|---|---|---|---|
| No-code: Moving-average cross | +58.78% | -40.48% | 1.39 | 49 |
| Code: ma_cross | +58.78% | -40.48% | 1.39 | 49 |
| No-code: RSI oversold rebound | -7.61% | -60.47% | -0.28 | 60 |
| Code: rsi_reversion | -7.61% | -60.47% | -0.28 | 60 |
Common mistakes
Look-ahead
Deciding on today's close and assuming a fill at today's close produces results no one could have had. The kit puts only completed bars up to the decision's bar into ctx and fills at the next bar's open, so code has no way to reach a future bar. Writing future knowledge into the code yourself (say, leaving out a coin you know gets delisted next month) is still look-ahead.
Overfitting
Trying dozens of parameter values and keeping the best gives a strategy that only fits the past. Choose parameters on the in-sample period, then check the out-of-sample period and the sensitivity table. Piling on conditions is the same problem.
Survivorship bias
Backtesting only what trades today leaves out what disappeared in between, which flatters the result. Be careful with candidate lists such as top N by turnover.
Leaving out fees and slippage
Strategies that trade often are sensitive to costs. Most strategies that look good with zero fees and slippage don't hold up. Read the total fees, slippage and number of trades on the result screen together.
Keeping state in module globals
In a code strategy, keep anything that must carry over between bars in ctx.state. Module globals start fresh in a new process on every run, so the backtest and the live run would disagree.
Safety and security
API keys stay on your computer
Exchange and broker API keys are stored, encrypted, only in the kit on your computer and are never sent to AvalonQuant's servers. No withdrawal permission is needed: switch it off when you create the key, and register an allowed IP if the exchange supports it.
Virtual trading and read-only keys
To start virtual trading, enter a live API key as a read-only (market data) key. No order is sent in virtual trading; the kit fills orders against the real prices it reads with that key. Only live trading uses a key that can place orders.
The code sandbox
A code strategy runs in a separate process on your computer. It starts with an empty environment in an empty temporary folder, and writing files, reading the kit's folder, the network, starting other programs and reading environment variables are all blocked, so strategy code can't reach your API keys. Each decision has a time and memory limit, so an endless loop or runaway memory stops only that strategy.
When something fails
If strategy code raises an error, only that strategy stops, and the alert channels you set up (Telegram, webhook) get the line number and the error. Other strategies keep running. Fix the code and save it, and it runs again.
Strategy files from someone else
An unsigned strategy file shows as a 'user file' and doesn't run until you confirm the warning. Read its code and backtest yourself, and run it in virtual trading before live trading.
FAQ
Can I build a strategy without coding?
Yes. Assemble indicator, comparison and value blocks in the no-code tab. Rotations and rules that need state are easier in the code tab.
Can a code strategy use other libraries or data from the internet?
No. Only math, statistics, numpy, pandas and the AvalonQuant indicator module can be imported, and the network is blocked. Prices come through ctx.
Do minute or hour bars work?
Only daily bars for now. Minute and hour bars open once the intraday engine is in.
How many strategies run for free?
Building and backtesting are unlimited; one strategy runs, in virtual trading. Paid plans run as many as their slots.
Does virtual trading need an API key?
Yes. It needs real prices, so enter a live API key as a read-only market-data key to start. No order is sent.
If the backtest looks good, will live trading do as well?
No guarantee. A backtest is a check on past data; fills, costs and changing markets make live results differ. Check the out-of-sample period and sensitivity, then try it in virtual trading.
Can I commission a strategy?
Yes. Send your rules through a development request and we deliver them signed in this format (.py or a rule file). Scope and payment are confirmed separately.
Disclaimer
This guide and its examples are educational. They are not investment advice and no performance is guaranteed. A backtest is a check on past data and does not guarantee future returns. Live trading results and decisions are your own responsibility; start live trading with small amounts.