이 글은 영어로 작성된 이전 연구 노트입니다. 수치와 기간은 발행 당시 그대로입니다.
Welcome to Avalon QuantBrief, where we dissect high-performance systematic trading strategies to uncover their true risk-return profiles. Today, we analyze the famous Velocity Strength Filter, a momentum-driven strategy boasting a 17.6 percent CAGR but carrying a significant 27.5 percent maximum drawdown. We will break down its mechanics, explore our optimized modifications, and evaluate whether its high-risk profile is suitable for your portfolio.
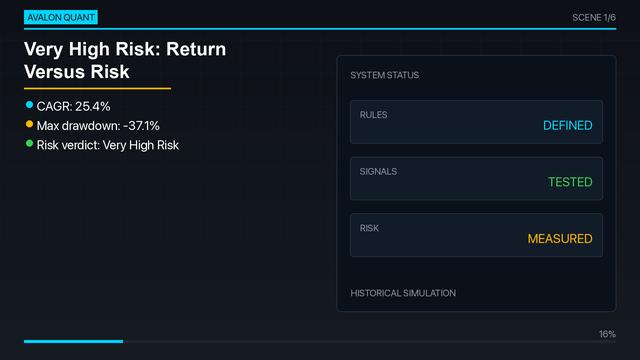
📈 CAGR: 17.6%
📉 Max Drawdown: -27.5%
⚡ Sharpe Ratio: 0.84
💰 Total Return: 402.9%
🎯 Universe: US leveraged index ETFs, defensive assets and cash-like funds
High Risk: Return Versus Risk
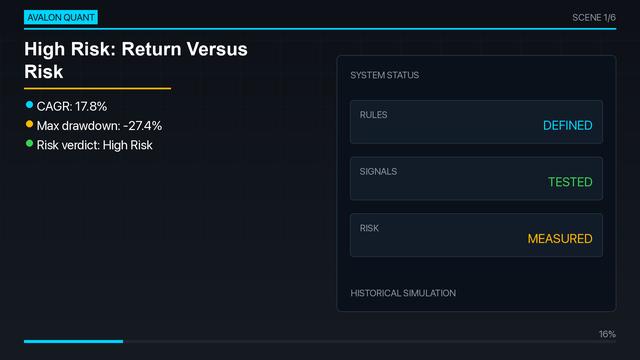
While the Velocity Strength Filter boasts an impressive headline CAGR of 17.6 percent, it comes with a substantial maximum drawdown of 27.5 percent, placing it firmly in the high-risk category. Before examining the returns, investors must understand the underlying rules, the volatile return path, and the extended loss periods that define this strategy. This briefing provides an honest look at these risks to help you determine if the strategy is practically tradeable.
Mechanics of the Velocity Strength Filter
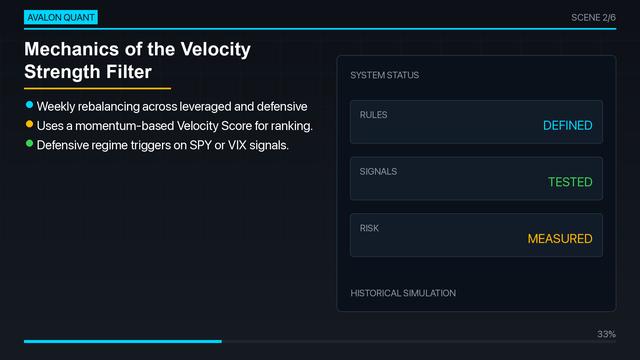
The original strategy rebalances weekly across high-beta leveraged ETFs and defensive assets, ranked by a momentum score. A market-regime rule moves the portfolio to the strongest defensive asset when the broad market trend or volatility conditions turn against it, aiming to capture upside while limiting damage in sell-offs.
Optimizing the Momentum Engine
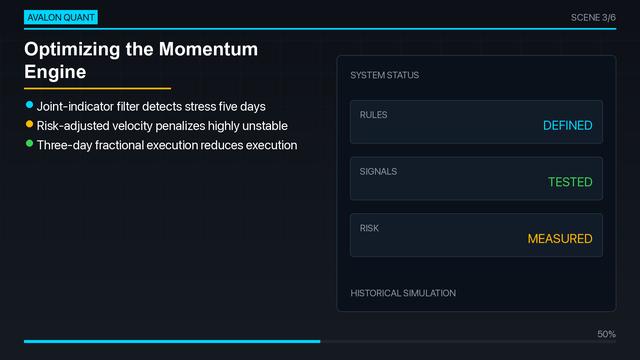
Our adapted version adds three kinds of change: a faster market-health filter, a risk-adjusted momentum ranking that favours steady trends over volatile spikes, and a gradual execution model that reduces risk in steps to limit slippage. The exact rules and parameters are not published.
Verified Backtest Results
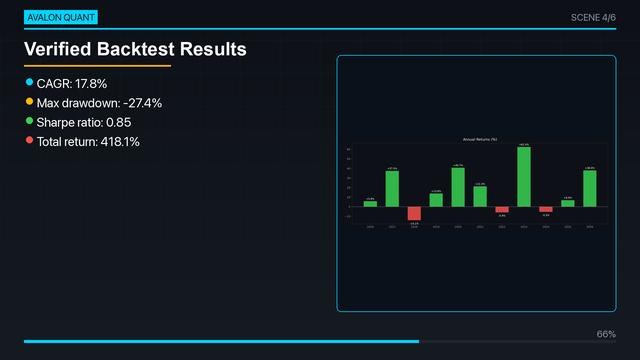
In historical simulations, our verified backtest of the Velocity Strength Filter produced a 17.6 percent CAGR, a 0.84 Sharpe ratio, and a 402.9 percent total return, alongside a 27.5 percent maximum drawdown. It is vital to remember that these are historical simulation results, not a guaranteed forecast of future performance. When evaluating this strategy, the depth of the drawdown is just as critical as the return metrics in determining its real-world viability.
Profit And Loss Regimes
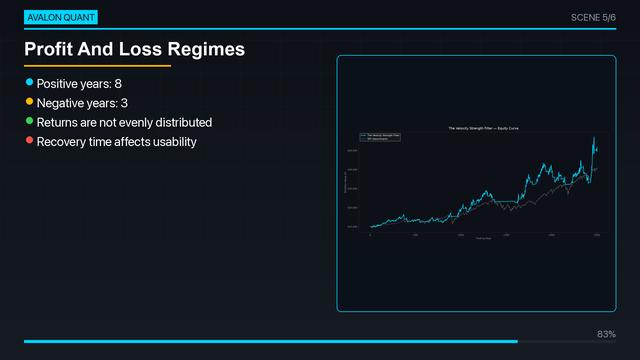
Analyzing the equity curve reveals that returns arrive highly unevenly, with the backtest recording 8 positive years and 3 negative years. To judge if this strategy can be held in practice, traders must look beyond the headline CAGR and carefully review the drawdown depth and recovery times. Understanding these distinct profit and loss regimes is essential for surviving the inevitable periods of underperformance.
Verdict: High Risk
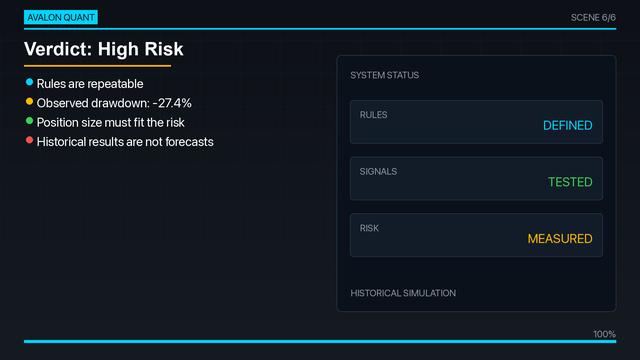
Our final verdict classifies the Velocity Strength Filter as a high-risk strategy due to its significant 27.5 percent historical drawdown. Any live implementation would require strict position sizing and robust risk management to survive these deep equity swings. Treat these findings strictly as research, compare them against alternative models, and never assume past backtest performance will repeat in live markets.
⚠️ Not financial advice. This is for educational purposes only. Always do your own research before investing.
Go further on AvalonQuant
- Velocity Strength Filter: re-run backtest — equity curve, max drawdown -27.5%, CAGR 17.6% (2016–2026), and how it ranks by drawdown.
- All strategy backtests — every strategy we re-ran, with equity curves and drawdowns side by side.
Backtests are hypothetical and do not guarantee future results. Not investment advice.
면책: 이 글은 과거 데이터에 대한 백테스트(가상 시뮬레이션)를 다룬 교육용 연구 자료이며 투자 권유가 아닙니다. 실제 거래 결과가 아니고 미래 수익을 보장하지 않습니다. 투자 판단과 손실 책임은 본인에게 있습니다.
AvalonQuant는 주식, ETF, 암호화폐 전략을 실제 데이터를 바탕으로 검증하는 독립적인 퀀트 연구 플랫폼입니다. 전략의 수익뿐 아니라 손실, 위험, 백테스트의 한계와 재현 방법까지 공개합니다.