이 글은 영어로 작성된 이전 연구 노트입니다. 수치와 기간은 발행 당시 그대로입니다.
Investors often assume that momentum strategies tracking 52-week highs in leveraged instruments guarantee benchmark outperformance, but compounding decay and defensive exit lag frequently erode those gains. In this historical simulation, the strategy produced a 14.9% annualized return alongside a severe -34.5% maximum drawdown. Evaluating this system requires weighing its automated cash-preservation rules against the substantial friction inherent in trading high-beta leveraged products.
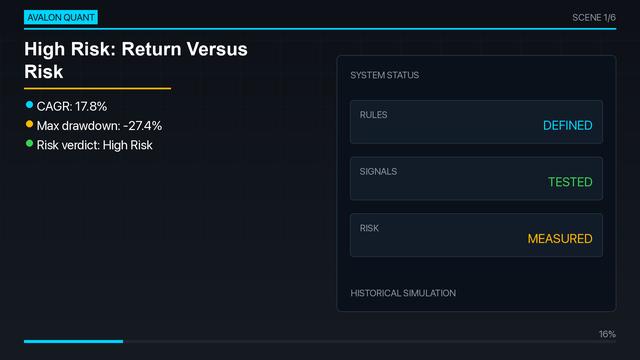
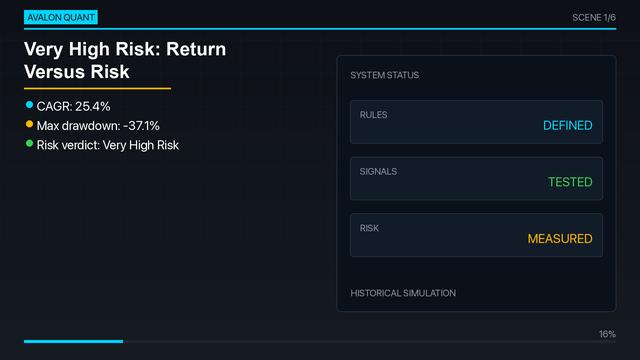
📈 Yearly return (CAGR): 14.9%
📉 Worst drop (max drawdown): -34.5%
⚡ Sharpe Ratio: 0.71
💰 Total Return: 296.5%
🆚 S&P 500 (SPY) over the same period: 315.6% — this strategy underperformed by 19.1 points
🎯 Universe: US leveraged index ETFs, defensive assets and cash-like funds
| Metric | The Fifty-Two Week High Leaderboard | S&P 500 (SPY) |
|---|---|---|
| Total return | 296.5% | 315.6% |
| Worst drop (max drawdown) | -34.5% | -33.7% |
| Period measured | 2016-09-27 – 2026-09-08 | |
Both columns come from the same backtest run over the identical period. A higher return with a deeper drawdown is not automatically better.
| 2016 | 2017 | 2018 | 2019 | 2020 | 2021 | 2022 | 2023 | 2024 | 2025 | 2026 |
|---|---|---|---|---|---|---|---|---|---|---|
| -1.0% | +72.9% | +7.5% | +16.5% | +17.6% | +7.7% | -9.8% | +12.3% | +31.7% | +17.5% | -6.9% |
How the Rule Works
Every week, the strategy ranks a basket of leveraged index ETFs by how strongly and steadily they are trading near their highs, favouring persistent upward momentum over erratic spikes. Capital rotates into the highest-ranking funds on a fixed schedule, without discretionary intervention. A market-trend safety gate decides whether any risk is taken at all: when the broad market trend weakens, the portfolio moves to a cash-like fund, and daily stop rules limit losses between rebalances. The exact rules and parameters are not published.
Why It Can Beat or Lose to the Index
Over the evaluated period, the strategy did not beat the S&P 500, delivering a 296.5% total return that trailed the benchmark’s 315.6% return by 19.1 percentage points while taking on a slightly worse drawdown (-34.5% versus -33.7%). Leveraged exchange-traded funds suffer severe volatility drag and compounding decay during choppy or sideways regimes, destroying capital faster than unleveraged equity baskets. Additionally, the moving-average safety gate inherently lags market inflection points, exiting after drops have already begun and missing the sharpest initial phases of market rebounds.
Where It Hurts
The aggregate return conceals severe path dependency, characterized by eight profitable years offset by three punishing negative years. Enduring a 34.5% peak-to-trough collapse requires an asset to generate a 52.7% rebound just to reach breakeven, which is especially grueling when holding volatile 3x products through whipsawing trend changes. The psychological strain of trailing a passive index during strong bull markets while enduring sudden, sharp cash-rotation triggers presents a formidable barrier to disciplined execution.
Who This Fits
This profile carries a firm high-risk classification, making it suitable only for aggressive quantitative investors who can tolerate deep drawdowns and pronounced tracking error against standard benchmarks. Allocators must size positions conservatively to survive historic drawdown regimes rather than treating the model as a core portfolio replacement. Successful deployment demands complete automation, as any discretionary second-guessing during steep equity drawdowns undermines the systematic risk filter.
Frequently Asked Questions
How risky is this strategy?
The strategy carries high risk due to concentrated exposure to 3x leveraged ETFs, historically realizing a deep -34.5% maximum drawdown and three full negative years.
Can this strategy be traded today?
Yes, it can be traded using publicly listed leveraged ETFs and ultra-short cash proxies, provided you follow the mechanical weekly ranking and safety-gate rules without discretionary deviation.
What does the backtest assume?
The backtest assumes frictionless weekly rebalancing, zero execution slippage, instantaneous liquidity across all listed instruments, and no transaction costs or tax drag.
| Period | 2016-09-27 – 2026-09-08 |
| Universe | US leveraged index ETFs, defensive assets and cash-like funds |
| Years with a gain | 8 of 11 |
| Price data | FinanceDataReader daily bars |
What this does not prove. No out-of-sample split and no parameter-sensitivity test were run, so these figures may be flattered by hindsight. Signals are computed only from bars that closed before the session they trade. Full assumptions, including which integrity checks are unverified: avalonquant.com/methodology.
📊 A new strategy backtested every day — the numbers, the drawdown, and what breaks it.
▶ Subscribe to Avalon Quant⚠️ Not financial advice. This is for educational purposes only. These results come from a historical backtest — past performance does not guarantee future results. Always do your own research before investing.
📊 Live strategy performance and daily quant briefings: avalonquant.com
📄 Original paper: The 52-Week High and Momentum Investing
Go further on AvalonQuant
- Fifty-Two Week High Leaderboard: re-run backtest — equity curve, max drawdown -34.5%, CAGR 15.8% (2016–2026), and how it ranks by drawdown.
- All strategy backtests — every strategy we re-ran, with equity curves and drawdowns side by side.
Backtests are hypothetical and do not guarantee future results. Not investment advice.
면책: 이 글은 과거 데이터에 대한 백테스트(가상 시뮬레이션)를 다룬 교육용 연구 자료이며 투자 권유가 아닙니다. 실제 거래 결과가 아니고 미래 수익을 보장하지 않습니다. 투자 판단과 손실 책임은 본인에게 있습니다.
AvalonQuant는 주식, ETF, 암호화폐 전략을 실제 데이터를 바탕으로 검증하는 독립적인 퀀트 연구 플랫폼입니다. 전략의 수익뿐 아니라 손실, 위험, 백테스트의 한계와 재현 방법까지 공개합니다.