이 글은 영어 원문입니다. 한국어판 읽기 →
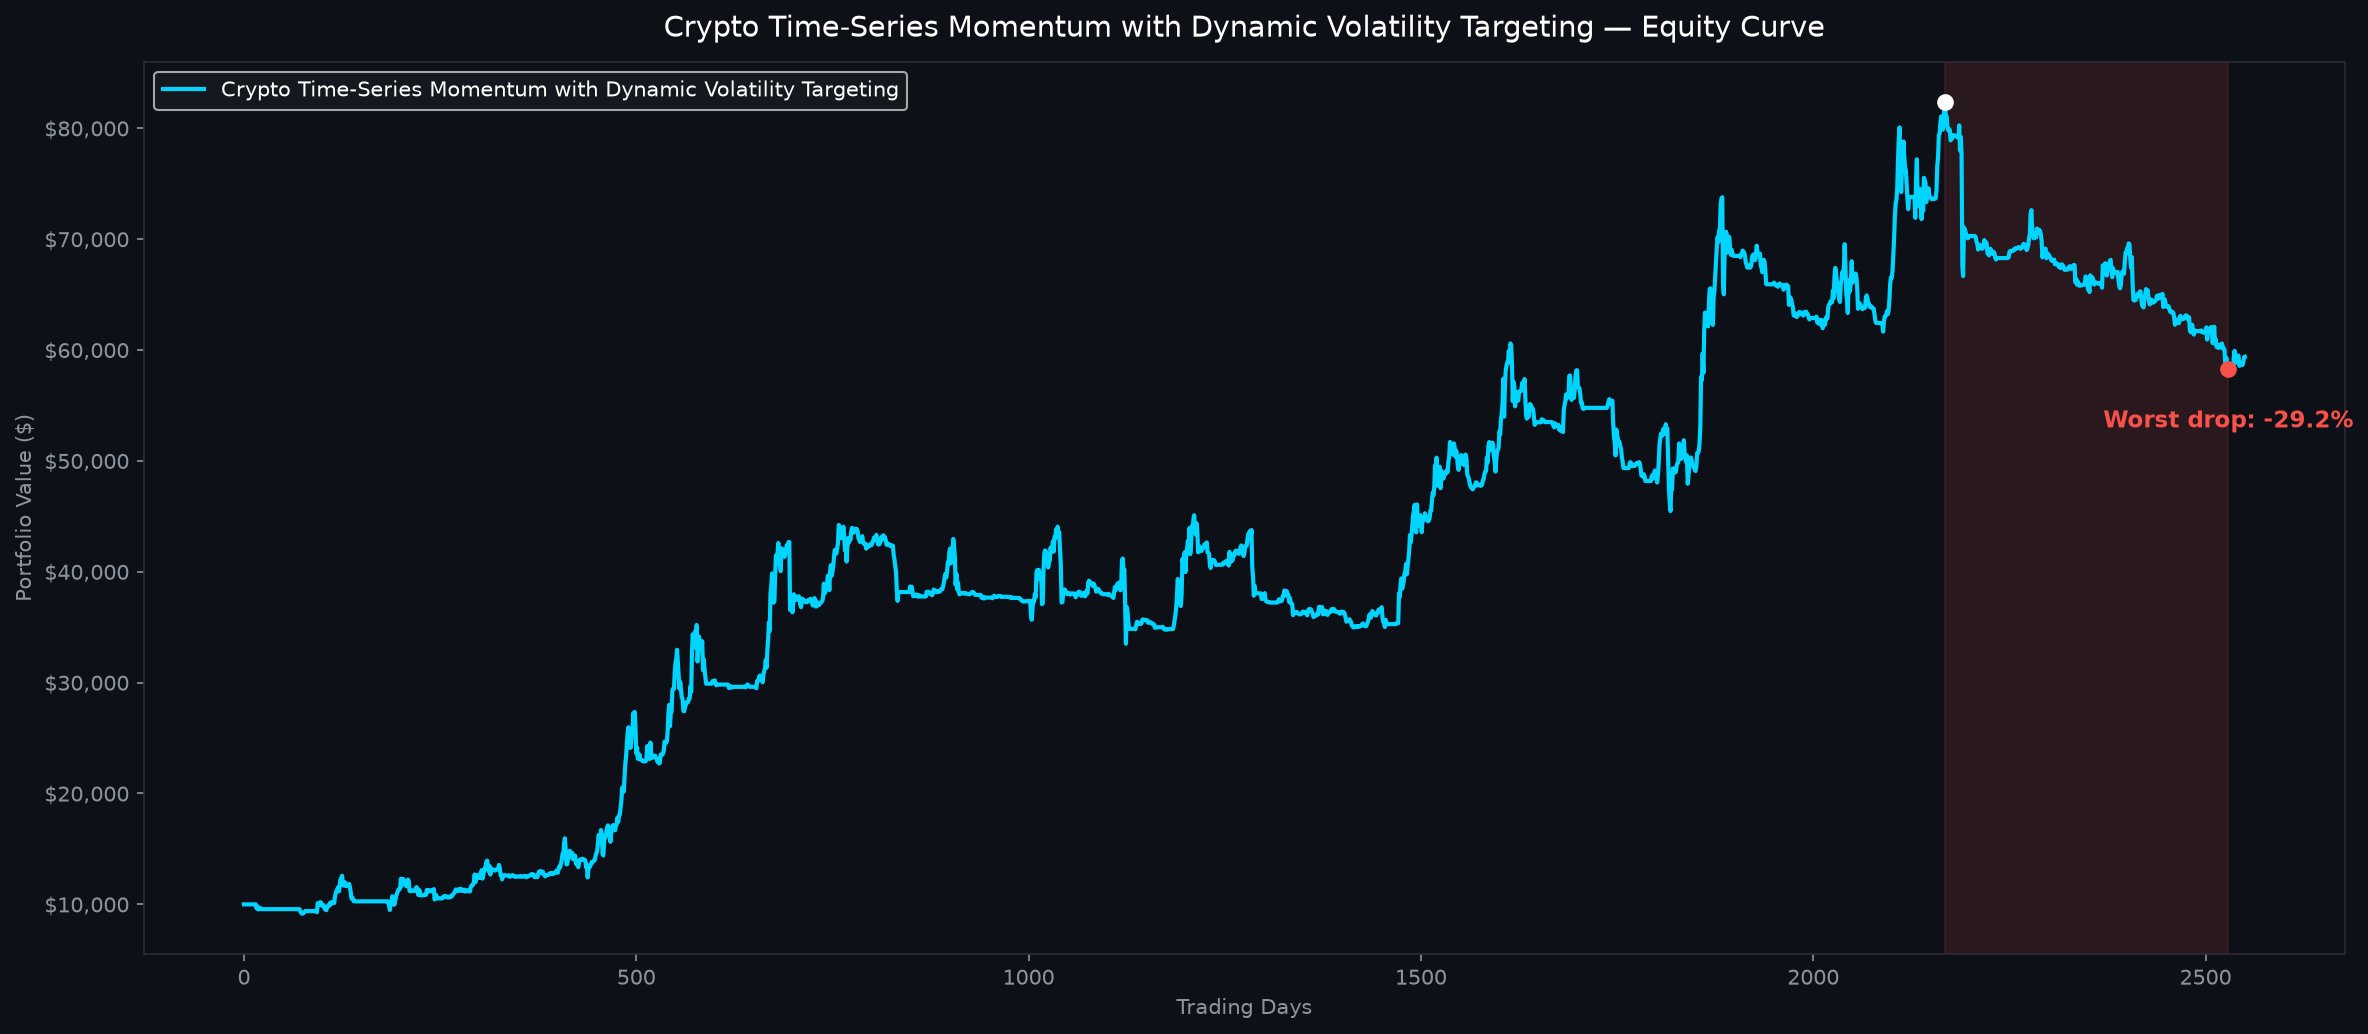
The headline simulation generated 29.1 percent a year from October 2019 to October 2026, but it came with a grueling 29.2 percent worst drop along the way. Adapting the cryptocurrency time-series momentum framework established by Yukun Liu and Aleh Tsyvinski (2021), this rule systematically rides top-performing tokens while stepping into cash when Bitcoin weakens. This briefing walks through the mechanics, the lack of an available same-period benchmark, and the heavy drawdowns that place this strategy squarely in the aggressive risk tier.
📈 Yearly return (CAGR): 29.1%
📉 Worst drop (max drawdown): -29.2%
⚡ Sharpe Ratio: 0.93
💰 Total Return: 493.9%
🎯 Universe: point-in-time top 20 USDT-M perpetuals by trailing volume
- This strategy passed every calculation-integrity check (data, costs, look-ahead, leverage accounting), but these robustness checks did not pass and are disclosed instead: deflated Sharpe ratio (luck across many tested candidates).
- Deflated Sharpe ratio: 0.52 (confidence level 0.95). This strategy was selected from many backtested candidates. Its deflated Sharpe ratio is below the 0.95 confidence level, so the backtest result may be luck and cannot be ruled out as such.
- Out-of-sample period 2022-12-31 to 2026-10-05: 15.3% a year with a -29.2% worst drop (return/drawdown 0.523) vs Bitcoin 54.9% / -53.0% (1.036) — it lagged the benchmark on a risk-adjusted basis.
- Bear-market losses: 2020 Feb-Mar -18.3% (Bitcoin -54.0%); 2022 -23.9% (Bitcoin -66.9%).
- Leverage: none (1x).
- Maximum drawdown in the full backtest: -29.2%.
- Steady compounder: it aims to earn less than buying and holding Bitcoin with smaller drawdowns. Over 2019-10-12 to 2026-10-05 it made 29.1% a year with a -29.2% worst drop, vs 16.4% a year for a 28% Bitcoin / 72% cash mix held to the same worst drop.
- The steady-compounder criterion was finalized after earlier screening results were seen, so selection bias cannot be ruled out.
- Not forward-verified: this is a historical backtest, and the strategy's paper-trading record is still in progress.
| 2019 | 2020 | 2021 | 2022 | 2023 | 2024 | 2025 | 2026 |
|---|---|---|---|---|---|---|---|
| -6.1% | +48.5% | +205.9% | -18.5% | +45.4% | +35.2% | +0.9% | -13.9% |
How the Momentum and Macro Rule Operates
The universe is the top twenty USDT-margined perpetual contracts by trailing 30-day dollar volume, chosen point in time from every perpetual listed on that date, including ones later delisted. Once a week, each coin gets two trend votes from its 7-day and 28-day returns (+1 if positive, −1 otherwise). Coins whose average vote is positive are held long, weighted by the inverse of their 30-day volatility, with total exposure capped at 1x; when no coin qualifies, the portfolio sits in cash. There is no leverage and no shorting. Signals use completed daily closes, and trades are assumed to fill at the next day’s open.
Why It Can Beat or Lose to the Benchmark Index

A direct same-period S&P 500 benchmark is not available in this backtest, so claiming it outperformed equity indexes would be ungrounded guesswork. Even when cryptocurrency models deliver higher nominal returns than equity indices, deeper peak-to-trough drawdowns mean that higher gains are not automatically better on a risk-adjusted basis. The strategy can outperform market benchmarks during sustained crypto bull markets by concentrating exposure into high-velocity leadership tokens while cutting exposure during prolonged multi-month downturns. However, it severely lags broader benchmarks during choppy, sideways markets where frequent false trend signals incur trading friction, and during rapid V-shaped rebounds where holding cash causes significant lag.
Where the Strategy Hurts: Friction, Chop, and Robustness Fragility

The most painful phase occurs when coin trends flip back and forth, so the weekly 7-day and 28-day votes keep switching and the strategy pays trading costs to exit and re-enter positions just before reversals. Although the rules mitigated losses during severe historical market crashes, the strategy significantly lagged simple buy-and-hold benchmarks on a risk-adjusted basis during out-of-sample testing. Critical robustness audits reveal that the deflated Sharpe ratio fell well below acceptable statistical confidence thresholds, meaning the simulation’s recorded success may reflect candidate selection luck across many tested models. Furthermore, because the steady-compounder evaluation criteria were finalized only after reviewing initial screening outcomes, selection bias cannot be ruled out as an underlying contributor to these results.
Who This Fits: Aggressive Mandates and Downside Realities
This framework is classified strictly as Aggressive tier · Steady compounder, meaning it is suited solely for high-risk allocators who can comfortably withstand severe capital drawdowns. It fits systematic investors aiming to capture parabolic crypto trend runs while accepting lower overall returns than pure buy-and-hold strategies in exchange for disciplined downside stops. It is entirely unsuited for conservative capital, passive index investors, or anyone requiring stable liquidity, as enduring lengthy recovery periods demands strict position sizing and patience. Because this remains an unverified historical simulation with paper-trading validation still in progress, prospective traders should treat the findings strictly as exploratory research rather than proven execution.
Frequently Asked Questions
How risky is this crypto momentum strategy?
The strategy is designated as Aggressive tier · Steady compounder, carrying substantial drawdown risks alongside a deflated Sharpe ratio below the ninety-five percent confidence threshold, which means the historical performance may stem from selection luck. Investors face prolonged equity troughs during sideways markets and documented out-of-sample underperformance on a risk-adjusted basis compared to simple market holdings.
Can this strategy be traded live today?
No, this strategy cannot be deployed with live capital today because it is an unverified historical backtest whose forward paper-trading record remains in progress. Real-world execution must await live validation to ensure execution slippage, perpetual funding rates, and liquidity constraints match theoretical models.
What key assumptions does the backtest rely on?
The backtest rebalances weekly across the top twenty USDT-margined perpetuals by trailing 30-day dollar volume, chosen point in time, without leverage. Signals use completed daily closes and fills are assumed at the next day’s open, with a 0.10% cost on every trade and the actual historical funding payments.
| Period | 2019-10-12 – 2026-10-05 |
| Universe | point-in-time top 20 USDT-M perpetuals by trailing volume |
| Years with a gain | 5 of 8 |
| Price data | Binance USDT-M perpetual futures, daily bars (funding cost applied) |
What this does not prove. Signals are computed only from bars that closed before the session they trade. Full assumptions, including which integrity checks are unverified: avalonquant.com/methodology.
More Backtests
Check the live record
📈 See Crypto Time-Series Momentum with Dynamic Volatility Targeting in our live paper-trading league →
Educational material. Past performance does not guarantee future results.
📊 A new strategy backtested every day — the numbers, the drawdown, and what breaks it.
▶ Subscribe to Avalon Quant⚠️ Not financial advice. This is for educational purposes only. These results come from a historical backtest — past performance does not guarantee future results. Always do your own research before investing.
📊 Live strategy performance and daily quant briefings: avalonquant.com
📄 Original paper: https://doi.org/10.1093/rfs/hhaa113
면책: 이 글은 과거 데이터에 대한 백테스트(가상 시뮬레이션)를 다룬 교육용 연구 자료이며 투자 권유가 아닙니다. 실제 거래 결과가 아니고 미래 수익을 보장하지 않습니다. 투자 판단과 손실 책임은 본인에게 있습니다.
AvalonQuant는 주식, ETF, 암호화폐 전략을 실제 데이터를 바탕으로 검증하는 독립적인 퀀트 연구 플랫폼입니다. 전략의 수익뿐 아니라 손실, 위험, 백테스트의 한계와 재현 방법까지 공개합니다.